
Analytics Overview
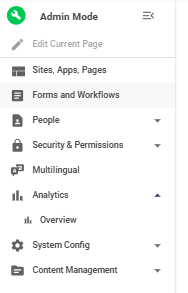
As an Administrator or Super Administrator navigate to Admin Home

1. Click on Analytics in the admin mode
Overview Dashboard
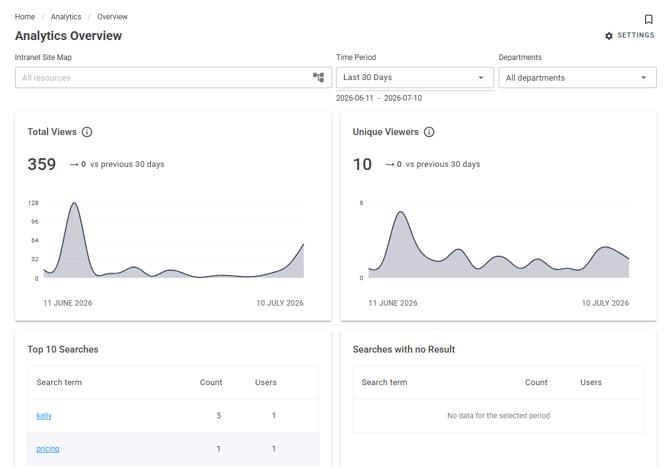
The Overview Dashboard provides a comprehensive view of your intranet's performance and user engagement.
2. Click on Analytics > Overview
Dashboard Metrics
At the top of the dashboard you will see key performance charts that update based on your selected filters:
Total Views Chart displays the total number of page views across your intranet each day. Higher numbers indicate more activity and engagement based on the time period selected.
Unique Viewers Chart shows the number of unique users visiting your intranet each day.
Reports
Top 10 Searches displays the most popular search terms used by your users, helping you understand what information users are looking for and identify gaps in your content organization.
Searches with no results displays search terms that returned no results. This report helps identify missing, outdated, or difficult-to-find content, allowing administrators to improve searchability by creating new content, updating existing pages, or adding relevant keywords and metadata.
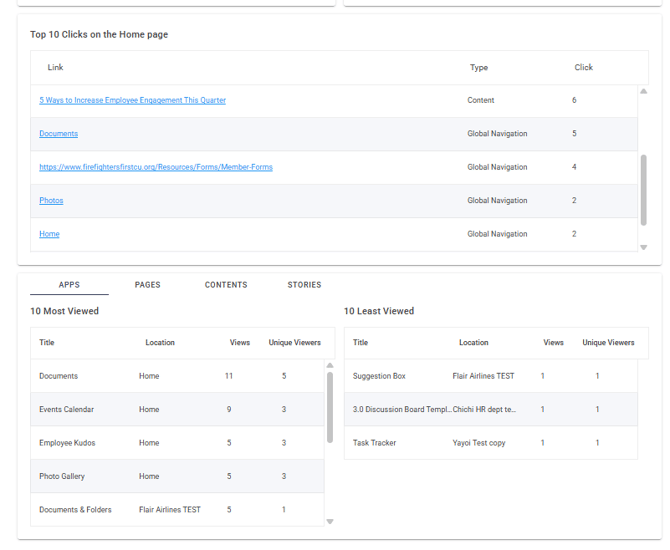
Top Clicks on Home Page shows the most clicked items from your intranet home page, helping you understand which home page elements are most valuable to users.
Table Columns:
- Item Name: The link or item that was clicked
- Click Count: Number of times it was clicked
Most/Least Viewed Apps displays applications ranked by total views. Use the tabs to toggle between Most Viewed (your most popular applications) and Least Viewed (applications that may need promotion or evaluation).
Specific App Content Views appears when filtering by a specific application, showing view counts for individual items within that app.
Applicable to Apps, Pages, Contents and Stories
Want to see the analytics dashboard and (3.0 engagement tools) in action? Check out our webinar recording here.